

Fall 2025 Market Vibes: Is a “Second Spring” on Deck?
Summer was… fine. Not thrilling, not terrifying—just a little sleepy. But fall might be the caffeine shot the housing market needed. Mortgage rates slipped under 6.5% recently, and purchase applications jumped double digits versus last year. Translation: more buyers stretching, lacing up, and stepping back onto the field.

What the latest numbers really mean (in human speak)
Sales: Existing-home sales were basically flat in August (−0.2% vs. July), but still +1.8% year over year. That’s not fireworks—more like a steady green light. It suggests the market found its footing after a wobbly stretch.
Prices & wealth: The median existing-home price is $422,600, up 2% YoY. Only 2% of sales are distressed (near historic lows), and cash buyers still account for 28% of deals—hello, equity. NAR’s research estimates the typical homeowner gained about $140,900 in wealth over the last five years (and roughly 49% appreciation since 2019). In short: lots of owners are sitting on serious cushion.
Inventory & pace: Buyers finally have more to look at. Inventory is up ∼12% year over year, and the median time on market is 31 days (26 a year ago). Imagine 2021’s sprint turning into a brisk jog—still moving, just less breathless. That extra time can mean inspections, repairs, and fewer “blink and you missed it” moments.
Rates & demand: 30-year fixed slipped below 6.5%, and purchase apps are up 18% YoY. That doesn’t flip the market overnight, but it does coax rate-weary buyers off the sidelines—especially those who were pre-approved all summer and waiting for a better shot.
Why fall could feel like a “second spring”
Agents are already seeing more listings and a bit more negotiating power for buyers (yes, inspections are cool again). Realtor.com even circled Oct. 12–18 as a prime buying window—expect more listings and slightly lighter competition that week. (Pumpkin-spice open houses optional.)

Regional Pulse (August Snapshot)
Northeast: Sales −4% MoM, −2% YoY; median **534,200∗∗(+6.2%$ YoY). Tight inventory = strong prices.
Midwest: +2.1% MoM, +3.2% YoY; median **330,500∗∗(+4.5%$ YoY)—about 22% below the national median, aka value hunter territory.
South: −1.1% MoM, +3.4% YoY; median **364,100∗∗(+0.4%$ YoY). Big region, varied stories city to city.
West: +1.4% MoM, −1.4% YoY; median **624,300∗∗(+0.6%$ YoY). Pricey, but stabilizing.
If you’re buying
Timing: Use the next few weeks (and that Oct. 12–18 window) to pounce on new listings without the spring stampede. Strategy: Get fully underwritten, shop lenders for a float-down option, and budget for inspections/repairs you couldn’t win last year. Mindset: If the home you love doesn’t get 10 offers on day one—good. That’s your opening to ask for closing help or repairs.
If you’re selling
Price reality, not nostalgia. Buyers have options again; the right price + turnkey prep still sells quickly. Leverage your equity. With homeowner wealth up, many move-up sellers are writing stronger offers—some all-cash—on their next place. Make it easy to say yes. Pre-list tune-ups, clean inspections, and small concessions can beat a price cut later.
Northern Virginia Note
I’m local. If you’re in Prince William or nearby, I’ll run a hyper-local snapshot (days on market, list-to-sale ratios, recent comps) and tailor a buy-and-sell plan that fits your timeline—no pressure, no jargon, just clear next steps.
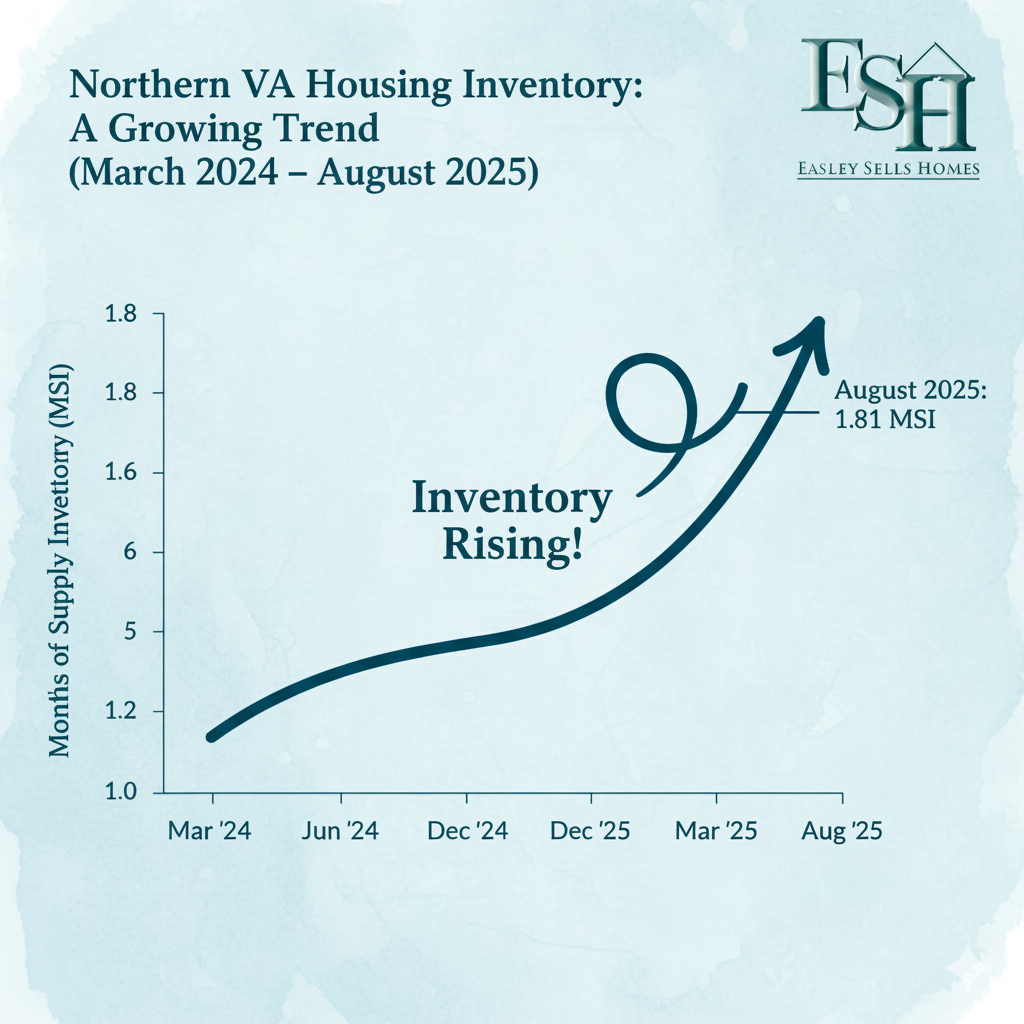
NoVA's Active Inventory is Up—Giving Buyers More Room More homes are hitting the market in Northern Virginia—and that’s good news for buyers. Months of supply rose to 1.81 in August 2025 from 1.38 a year ago, which basically means about 31% more breathing room. In real life terms: you’ll see more listings, there’s less rushing to make an offer, and you have a better shot at keeping inspections, asking for repairs, or negotiating a credit. We’re still below a true “balanced” market (usually ~4–6 months of supply), so good homes won’t sit forever—but the frenzy is easing, and your options are improving.
Data notes: Most stats above are August 2025 readings; rate and application figures reference late September 2025. Source: National Association of REALTORS® (NAR) reporting and references within the article linked below.